Friday 31 May 2019

lidar - Determining bare earth DEM from unclassified LAS file?


I have data in LAS format with RGB values created from aerial photogrammetry using a UAV. I am trying to find a solution to extract the bare earth DEM from the point cloud.


I have tried SAGA, Fusion, MCC-LIDAR, but it is seems they need the LAS file to be already classified (which it naturally isn't). Can anyone point me in the right direction with a brief explanation of the process?


Generally, I would need to process about 100 mill points at a time (can tile them if needed).


Viewing map tiles from Maperitive in leaflet or openlayers


I generated tiles in Maperative. Created following html file:


, but do not see a map - only a form for map with +- buttons. What could be a problem?


I configured both the openlayers and leaflet, but it seems that this programs seek wrong folder/folder/file.png names on coordinates I provide. But I have no idea how to set this names in Maperative, I see many people generate tiles using mapnik, but as I understand, to do this I need to set up a database and something else. Maybe there is an easier method?


Answer


You better specify the full path to the tiles. In Openlayers I added these lines:


    var MyMapnikLayer = new OpenLayers.Layer.OSM("myMapnik", "file:///D:/Tiles/myMapnik/${z}/${x}/${y}.png", {numZoomLevels: 16, alpha: true, isBaseLayer: true, visibility: false});
map.addLayer(MyMapnikLayer);


This is for Windows; Linux and Mac might have different ways to give absolute paths.


You can also take a look at the error console of your browser to see if something else is wrong.


How to keep spatial information after raster processing of satellite data in r


In R raster package i write an image in tiff format after certain raster processing but the spatial information is missing of new image. That's why i have to geo-reference the image again. How this can be avoided? For example, i want to get relative normalization image of landsat data. The code is


library(landsat)
library(raster)
library(lmodel2)
library(rgdal)

a<-raster("D:/Paper/test/1997-137-b3.tif")
x<-as.matrix(a)
b<-raster("D:/Paper/test/2007-137-b3.tif")
y<-as.matrix(b)
z<-relnorm(master = x, tofix = y, nperm=100, method="MA")
RMA was not requested: it will not be computed.

image(z$newimage)
m<-raster(z$newimage)
writeRaster(m, filename="D:/Paper/test/2007-b3-rd.tif", format="GTiff", options="INTERLEAVE=BAND", overwrite=TRUE)


But after processing the file i write in raster format missing spatial information.


Answer


You can try:


# Set up a new "empty" raster inheriting the geo-information from `a`
m<-raster(a)

# Set the values of the new raster
setValues(m, z$newimage)


writeRaster(m, filename="D:/Paper/test/2007-b3-rd.tif", format="GTiff", options="INTERLEAVE=BAND", overwrite=TRUE)

HTH


coordinate system - Choosing the correct value for proj4string for shapefile reading in R?


I am having a shapefile of polygons and another CSV file which contains a list of points as (Lat, Lng) pairs..


I want to check for each (lat, lng) pair from the CSV file which polygon does it fall inside..


The shapefile is projected and the proj file reads like this:


PROJCS["Transverse_Mercator",GEOGCS["GCS_OSGB 1936",
DATUM["D_OSGB_1936",SPHEROID["Airy_1830",6377563.396,299.3249646]],PRIMEM["Greenwich",0],UNIT["Degree",0.017453292519943295]],PROJECTION["Transverse_Mercator"],PARAMETER["latitude_of_origin",49],PARAMETER["central_meridian",-2],PARAMETER["scale_factor",0.9996012717],PARAMETER["false_easting",400000],PARAMETER["false_northing",-100000],UNIT["Meter",1]]

My plan is as follows:


  1. Read the shapefile using the readShapePoly function in the R MapTools package.

  2. Read the points coordinates from the CSV file into a dataframe and convert it to SpatialPointsDataFrame


  3. Use over function to determine which polygon it falls inside.


In order to do so, I need to specify the proj4string while loading the shapefile in step 1 and also transform the coordinates from the CSV file into the same projection system using spTransform function before applying the over function in step 3 as it requires that the points and polygons must be under the same projection system.


Any idea about what should the correct value for the proj file content shown above ?


Answer


The proj4string is a valid PROJ4 crs string.


see How can I get the proj4 string or EPSG code from a shapefile .prj file? and Shapefile PRJ to PostGIS SRID lookup table?


in short:


  • You can use gdalinfo as in the first reference or the GDAL Python bindings as in the second reference.


Or


  • go to Prj2EPSG (a simple service for converting well-known text projection information from .prj files into standard EPSG codes)

  • Enter the content of your prj file


enter image description here


  • the result is EPSG:27700 so a first version of the PROJ4 string is


    "+init=epsg:27700"


`Or


enter image description here


  • click on Proj4 and the complete PROJ4 string is:


    "+proj=tmerc +lat_0=49 +lon_0=-2 +k=0.9996012717 +x_0=400000 +y_0=-100000 +ellps=airy +datum=OSGB36 +units=m +no_defs"


QGIS not Printing to PDF


Simple QGIS 1.8.0 not printing to PDF. Suddenly stopped. Is this an error or something. the resultant PDFs are blank pages.


When i file print and use a pdf printer it creates blank docs. when i export to pdf it crashes. when i export to jpeg it does not print map.


Answer


I think it was the same old issue of lack of memory. In the end i reduced to 200dpi exported as jpeg and coverted to pdf after the fact. All in all i have it wrote down to too much information and too small of processor for this task...as it was massive.


Thursday 30 May 2019

statistics - Different models, different contours: are they comparable?


I will get contour lines of electromagnetic field strength around power lines. The contours will be calculated by different agencies using different models. We need to check whether the resulting zones (x meter from power line) around the power lines are similar between models/agencies. There is no 'gold standard' because it is not possible to actually measure the field strength on the ground. Furthermore, the zone is not simply a straight line because in some situations two power lines cross or approach each other and we are most interested in these deviating situations. Is there a way in GIS to compare the modelling results (polylines/contours) among each other?


postgis - how to snap two line vertex in two different layers used in QGIS


enter image description here


I want to snap between two poly-lines from 2 different layers (Layer1 in Brown and Layer 2(postGIS layer) in Pink color- ), but my snap option don't work. I have changed the tolerance to different levels but still not getting the results.


enter image description here


I don't get the magenta + sign to appear near vertices for snapping as many say it online.


  1. Which tool used for snapping? I know only the "Node tool" which is not working .


  2. I have set both layers editable (toggle editing set: ON)


  3. Is there any better plugins there(I have tried many available ones.)?


Please give me suggestions since I am a beginner in QGIS.


Answer


On your first picture no 'Enable Snapping' options... Make settings as shown below:


enter image description here


r - Creating scatterplot with icons (svg or png) instead of points?


I'm just starting with R and I wanted to know if it's possible to create a scatterplot with custom icons (svg or png) instead of points.


I started to import a shapefile, and then I have a set of points (latitude and longitude) that represents the location of the icons.


rm(list=ls())
library(ggplot2)

library(gstat)
library(sp)
library(maptools)
library(rgdal)

#plot
par(mar = c(2, 2, 2, 2))
root <- "C:/"
Al= readShapeLines("/DZA_adm0.shp")
require(rgeos)

simple.output <- gSimplify(Al, topologyPreserve = TRUE, tol = 3)
plot(simple.output,col="black")
(tab <- read.delim(file = paste(root, "/ville.txt", sep = "")))
dat <- SpatialPoints(coords = tab[, 2:3])
(dat <- SpatialPointsDataFrame(coords = tab[, 2:3], data = tab[,
+ c(1, 4)]))
# Rajout des capitales
plot(dat, pch =20, add = T,col="red")

# Extraction des coordonnees

lon <- dat@coords [, "lon"]
lat <- dat@coords [, "lat"]
# Extraction du nom des villes
labs <- as.character(dat@data[, "ville"])

enter image description here


Answer


rasterImage draws a raster image at a given location and size.


Below is a very rough example, which you can hopefully adjust to your needs. (I made up some location points, you would obviously have to use yours.)


library(rgdal)

library(png)

# load icons in PNG format
iconfile1 <- download.file('http://icons.iconarchive.com/icons/oxygen-icons.org/oxygen/256/Status-weather-clouds-icon.png', destfile = 'icon1.png', mode = 'wb')
icon1 <- readPNG('icon1.png')

iconfile2 <- download.file('http://icons.iconarchive.com/icons/oxygen-icons.org/oxygen/256/Status-weather-showers-scattered-icon.png', destfile = 'icon2.png', mode = 'wb')
icon2 <- readPNG('icon2.png')

# load shapefile

al <- readOGR("DZA", "DZA_adm0")

# make up some points
library(sp)
set.seed(613)
dat <- spsample (al, 3, type='random')

# need to offset the x/y location for the icon (depends on desired icon size)
offset <- 2


plot(al)
rasterImage(icon1, coordinates(dat)[1,1]-offset, coordinates(dat)[1,2]-offset, coordinates(dat)[1,1]+offset, coordinates(dat)[1,2]+offset)
rasterImage(icon2, coordinates(dat)[2,1]-offset, coordinates(dat)[2,2]-offset, coordinates(dat)[2,1]+offset, coordinates(dat)[2,2]+offset)
rasterImage(icon1, coordinates(dat)[3,1]-offset, coordinates(dat)[3,2]-offset, coordinates(dat)[3,1]+offset, coordinates(dat)[3,2]+offset)
points(dat)

enter image description here


file geodatabase api on osx mavericks via brewed gdal


I've got a new machine with a fresh install of OSX 10.9, and am having trouble getting esri's file geodatabase api to work correctly with my brewed gdal.


This is a known issue, noted here: http://forums.arcgis.com/threads/95958-OS-X-Mavericks


I've tried John Tull's noted workaround:


# install gcc
brew install --enable-cxx gcc49


# noted fgdb/gdal dependency:
brew install libdap --cc="gcc-4.9"

# gdal
brew install gdal --enable-unsupported --with-postgresql -v --cc="gcc-4.9"

# this points the fgdb libraries at gcc4.9 somehow
install_name_tool -change /usr/lib/libstdc++.6.dylib /usr/local/Cellar/gcc49/4.9-20131103/lib/gcc/x86_64-apple-darwin13.0.0/4.9.0/libstdc++.dylib /usr/local/opt/FileGDB_API/lib/libFileGDBAPI.dylib
install_name_tool -change /usr/lib/libstdc++.6.dylib /usr/local/Cellar/gcc49/4.9-20131103/lib/gcc/x86_64-apple-darwin13.0.0/4.9.0/libstdc++.dylib /usr/local/opt/FileGDB_API/lib/libfgdbunixrtl.dylib


This helps - ogr2info --formats now shows FileGDB as a valid format. However, running ogr2info on a valid filegdb gives this error:


ogrinfo(45386,0x7fff74779310) malloc: *** error for object 0x10b49dde0: pointer being freed was not allocated
*** set a breakpoint in malloc_error_break to debug

Any idea what I'm doing wrong? I tried removing all of the gdal dependencies and letting homebrew reinstall them when calling brew install gdal with the --c"gcc-49" flag but that didn't change anything.


edit - I now see that this issue already has a thread here Homebrew OGR with FGDB support on OSX 10.9


geoserver - Loading WMS layer from external server in Leaflet?


I'm trying to use the WMS service documented here in a leaflet map. The documentation shows an example for openlayers:


var wms = new OpenLayers.Layer.WMS(
"Population Density",
"http://sedac.ciesin.columbia.edu/geoserver/gwc/service/wms",
{layers: 'gpw-v3:gpw-v3-population-density_2000'}
);

but I want to use this with leaflet. My own WMS hosted layers work fine with the following syntax:


var wmsRivers = L.tileLayer.wms("http://zzz.zzz.zzz.zz:8080/geoserver/opengeo/wms", {
layers: 'opengeo:rivers',
format: 'image/png',
transparent: true,
version: '1.1.0',
attribution: ""
}).addTo(map);

The following does not:


var wmsFootprint = new L.tileLayer.wms("http://sedac.ciesin.columbia.edu/geoserver/gwc/service/wms", {

layers: 'gpw-v3:gpw-v3-population-density_2000',
format: 'image/png',
version: '1.1.0',
transparent: true,
attribution: ""
}).addTo(map);

After several minutes waiting for sedac.ciesen.colombia.edu, I get a 400 Failed to load resource: the server responded with a status of 400 (Bad Request)


Is there a way to ping the server to know it's functioning? What about version, I assume this refers to geoserver; how do I know what version they are running? Any other parameters I may be missing?


Answer


When exploring a new WMS you should always do a getcapablities request to start with - this will give you all sorts of useful information (including if the server is working). So first we try


http://sedac.ciesin.columbia.edu/geoserver/gwc/service/wms?request=getcapabilities


which responds with an xml document - so the server is up, opening the file it starts with


so you should probably ask for version 1.1.1


searching for the layer name gives me:


gpw-v3:gpw-v3-population-density_2000

Population Density 2000
Gridded Population of the World: Future Estimates (GPWFE) consists of estimates of human population for the years 2005, 2010, 2015 by 2.5 arc-minute grid cells. Population density estimates were also created using the GPWv3 land area grid for the year 2000 (also 2.5 arc-minute resolution). The data products include a population grid (raw counts), and a population density grid (per square km). These products vary in GIS-compatible data formats and geographic extents (global, continent [Antarctica not included], and country levels). Spatial reference metadata refers to global extent. A proportional allocation gridding algorithm, utilizing more than 300,000 national and sub-national administrative units, is used to assign population values to grid cells. Additional global grids are created from the 2.5 arc-minute grid at 1/4, 1/2, and 1 degree resolutions. (Spatial reference metadata refers to global extent, 2.5 arc-minute resoulution). GPWFE is produced by the Columbia University Center for International Earth Science Information Network (CIESIN) in collaboration with the United Nations Food and Agriculture Programme (FAO) and the Centro Internacional de Agricultura Tropical (CIAT).
EPSG:4326
EPSG:900913


so you can only request maps in epsg:4326 or epsg:900913 - you haven't shown enough code for me to see what projection you are using.


Finally look in firebug (or other debugger) to see what the url being requested is and try opening it in your browser - may be there is an error message being returned?


Using simple Math in SLD file on Geoserver?


Is it possible to use simple Math in an SLD file on Geoserver? Suppose I want to read a text size property from a database and multiply its value, how can I do this?


...

text_size * 2.1

...


This simple approach obviously doesn't work, so I thought there must be some way to achieve this.


Answer


You can use the math functions ogc:Mul ogc:Div ogc:Add & ogc:Sub to do simple maths on properties.


So your example would become:


text_size
2.5


The only issue is that technically the SLD specification may not allow you to use a function in a CssParameter. However GeoServer is much more forgiving and will allow it.


If you ever need more complex functions see the reference page.


Wednesday 29 May 2019

qgis - How to connect a PyQGIS plugin with Postgres?


I have some questions for you:


I created a python-plugin in QGIS,


then I created a Qt gui fom my plugin


and at last I created a Postgres DB


now I need to make a connection between Qt-gui and Postgres-DB


I wrote this


 from PyQt4.QtSql import *
db = QSqlDatabase.addDatabase("QPSQL");
db.setHostName("localhost");

db.setDatabaseName("siti");
db.setUserName("postgres");
db.setPassword("bina");
bool ok = db.open();

but it doesn't works, I can't understand what I do wrong...


I wish someone could help me...


thank you for all! lisa


qgis - OSGB36 to WGS84 reprojection 'error'


First off, I am a recent convert to QGIS and am greatly impressed with its ease of use and speed compared with the ESRI products with which I am more familiar - my congratulations and thanks to its developers (including the plug-ins).


I have surveyed (and corrected) DGPS (vector point) data collected to OSGB36 (British National Grid); these positions match acceptably well with the OSGB36 map layers to which I have access when imported as CSV and converted to SHP in QGIS, projected using EPSG:27700 (~1m error, although error could be in map layer which is suspect).


I'm attempting a four-stage export from QGISv1.7.4 to Google SketchUp (SU) via Google Earth (GE), as follows:


stage 1: In QGIS, Save as../KML with CRS set to WGS84 EPSG:4326 (or ETRS89);
stage 2: Open KML in GE;

stage 3: Save as KMZ;
stage 4: Open in SU.


Unfortunately, the exported WGS84 positions in the KML file are in error by ~8m - I've checked them against OSTN02 conversion using tool on OS website , I've also checked GE projection (by eye: converting GE lat/long to OSGB36 and comparing with OSGB36 vector map layer). (SU fails to open the KMZ file as well, but that's not a QGIS issue, I imagine - any hints welcome...).


So the evidence seems to point towards an error in the transformation from OSGB36 to WGS84 in stage 1, i.e. with QGISv1.7.4.


Any suggestions as to where the fault in my process might lie, or to an alternative approach, gratefully received...


thanks - JS


Deriving Z-score values for given field using ArcGIS for Desktop?


I have a shapefile with an attribute field with a range of numerical values.


How do I derive z-score values for this field using ArcGIS for Desktop?


Answer


Here are the steps for calculating Z-Scores in ArcGIS, in this case I have included some screen captures of calculating Z-scores for a field named SourceData.


  1. Open up the attribute table and right click on the field header for SourceData and select Statistics from the pop up menu. enter image description here


  2. Record the values for Mean and Standard Deviation. In this case the Mean is 565.43 and the Standard Deviation is 1954.39.

  3. Create a new field to store the Z-scores, make sure that this field is a Double.

  4. Right click on the field header of the new field you created in step 3.


  5. The formula for Z-Scores is SourceData - Mean / Standard Deviation. Here's what it looks like the Formula Calculator (Note the parenthesis around the first part of the formula): enter image description here


  6. You can check your results by running Statistics on the zscore field. A Z-score will have a mean of zero and a standard deviation of one. enter image description here


web mapping - How to georeference a web mercator tile correctly using gdal?


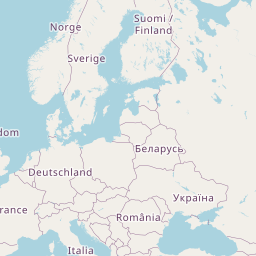
As an example I will take the following tile http://a.tile.openstreetmap.org/3/4/2.png and save it as "4_2.png".


The WGS84 coordinates of this tile can be calculated or read there by clicking the corresponding tile:


0 66.51326044311185 45 40.97989806962013 (West North East South)

How to georeference the tile correctly (using gdal to generate a geotiff or another georeferenced format) so that:


  • The bitmap don't need to be stretched (= the pixels in the geotiff are exactly the same as in the original bitmap)

  • The resulting image will be opened at the right place in a GIS viewer/editor (like for example in TatukGIS Free Viewer)?


(Edited at Sept 19 2011 to make my question clearer and include my conclusions)


My conclusion:


I first though that the third idea (see below) was the right one. I opened the geotiff in a GIS Viewer and compared the displayed coordinates with what I expected. The geotiff out of the second idea seems to be shifted 2 pixels towards north. That is why I considered idea 3 (or 4) as the right one.
But if you try with a tile at a much higher zoom level, the geotiff out of idea 3 is definitively shifted towards south. It was silly to compare coordinates on a tile of zoom level 3. The country boundaries at such zoom level are mus simplified so that the comparison doesn't give good results.


Dan S. was right, the tile image is already in EPSG:3857. The second idea is then the right one (and gives good result at high zoom levels too)


First idea: EPSG:4326
The EPSG code for WGS84 coordinates is EPSG:4326. So I simply use the WGS84 coordinates to georefence the tile as geotif using gdal_translate:


gdal_translate -of Gtiff -co tfw=yes -a_ullr 0 66.51326044311185 45 40.97989806962013 -a_srs EPSG:4326 4_2.png t4326.tif

The resulting map is displayed at the right place but I fear that the projection is not correct and that there might be a shift in the middle of the tile. After trying a long time to check that by reprojecting the map with gdalwarp, I downloaded a demo version of Global Mapper and this seems to be the case (sames borders as by idea 3 but a shift inside the tile). The image should be streched to be able to use EPSG:4326 coordinates .


Second idea: EPSG:3857
This tile use a "web mercator" projection (alias google map projection), which now has an EPSG code: EPSG:3857 (alias EPSG:900913). I simply convert the coordinates using gdaltransform:


gdaltransform -s_srs EPSG:4326 -t_srs EPSG:3857
0 66.51326044311185
0 10018754.1713946 0
45 40.97989806962013

5009377.08569731 5009377.08569731 0

My coordinates in meters are:


0 10018754.1713946 5009377.08569731 5009377.08569731 (West North East South)

Now I can use gdal_translate to generate a geotiff:


gdal_translate -of Gtiff -co tfw=yes -a_ullr 0 10018754.1713946 5009377.08569731 5009377.08569731 -a_srs EPSG:3857 4_2.png t3857.tif

My impression is that this is not correct because the borders of the maps are shifted toward north. It seems to be the right idea.


Third idea: EPSG:3857 through EPSG:4055
I read that "web mercator" uses WGS84 coordinates but consider them as if they where spherical coordinates. Due to the difference between a geodetic and a geocentric latitude (See Wikipedia about the latitude), the latitude values will not be the same on an ellipsoid or on a sphere. I found that EPSG:4055 is the code for spherical coordinates on a sphere based on WGS84.


Converting the coordinates to EPSG:4055:


gdaltransform -s_srs EPSG:4326 -t_srs EPSG:4055
0 66.51326044311185
0 66.3722684317026 -17964.0621483233
45 40.97989806962013
45 40.7894557844857 -9152.84527519904

The corresponding spherical coordinates are then:


0 66.3722684317026 45 40.7894557844857 (West North East South)

Then I do as if those coordinates where still on the ellipsoid (EPSG:4326) and convert them to web mercator:


gdaltransform -s_srs EPSG:4326 -t_srs EPSG:3857
0 66.3722684317026
0 9979483.26733298 0
45 40.7894557844857
5009377.08569731 4981335.86590183 0

The resulting coordinates differ from the one by idea2:


0 9979483.26733298 5009377.08569731 4981335.86590183 (West North East South)

Now I just have to write the coordinates into the map:


gdal_translate -of Gtiff -co tfw=yes -a_ullr 0 9979483.26733298 5009377.08569731 4981335.86590183 -a_srs EPSG:3857 4_2.png t3857_through_4055.tif

This third idea seems to give the best results. But I am not sure if it is correct. If idea 3 is correct, is there an EPSG code to do this operation in one step?


Fourth idea: EPSG:3857 through towgs84=0,0,0,0,0,0,0


gdal (and apparently epsg too) defines EPSG:3857 like that:


+proj=merc +a=6378137 +b=6378137 +lat_ts=0.0 +lon_0=0.0 +x_0=0.0 +y_0=0 +k=1.0 +units=m +nadgrids=@null +wktext +no_defs


whereas spatialreference.org like that:


+proj=merc +lon_0=0 +k=1 +x_0=0 +y_0=0 +a=6378137 +b=6378137 +towgs84=0,0,0,0,0,0,0 +units=m +no_defs

If I use the definition from spatialreference.org I got the correct coordinates in one step (Well I still don't if they are the "correct" coordinates but at least they are the sames as by idea 3):


gdaltransform -s_srs EPSG:4326 -t_srs "+proj=merc +lon_0=0 +k=1 +x_0=0 +y_0=0 +a=6378137 +b=6378137 +towgs84=0,0,0,0,0,0,0 +units=m +no_defs"
0 66.51326044311185
0 9979483.26733298 -17964.0621483233
45 40.97989806962013
5009377.08569731 4981335.86590183 -9152.84527519904


Why is there such a difference in the definitions of EPSG:3857?


Answer


The tile image is already in EPSG:3857. Why not just create a world file to reference it?


http://en.wikipedia.org/wiki/World_file


For the tile that covers N. America at zoom 1, you'd be looking at the following worldfile contents:


78271.517
0
0
-78271.517

-19998372.6
19998372.6

Where those numbers came from:


  • Line 1: width of an image pixel in world coordinates = 20037508.342789244 meters / 256 pixels.

  • Line 2 and 3: rotation, so n/a.

  • Line 4: height of an image pixel in world coordinates. Same as line 1 but negative, because in image files increasing y corresponds to 'down' while in the coordinate system, increasing y corresponds to 'up'.

  • Line 5: X coordinate in world coordinates of the center of the top-left pixel. This is -20037508.342789244, as reported by the tiles a la carte link, plus 1/2 of a pixel to bring it to the center.

  • Line 6: Ditto, only Y coordinate of the top left.


GDAL ought to pick up your worldfile (.pgw for the png); you'll still have to tell it EPSG:3857 on the command line.


(Note: didn't have time to test this, so it's all off the cuff... but hopefully correct on the first try anyway! ;)


Tuesday 28 May 2019

arcpy - Listing all feature classes in File Geodatabase, including within feature datasets?


From python how can I build a list of all feature classes in a file geodatabase (*.gdb), including inside feature datasets? The standard example only lists feature classes at the top level of the geodatabase:


import arcgisscripting, os
gp = arcgisscripting.create(9.3)

gp.workspace = 'd:\scratch.gdb'
fcs = gp.ListFeatureClasses()

for fc in fcs:
print fc

Please indicate which ArcGIS Desktop version your answer applies to (I am looking for 9.3 but we might as well collect all versions in one place).


Answer


I ended up using gotchula's answer, but without yield because I generally re-use the FC handles created and yield's are used once then discarded it's easier for me to read and understand what fcs.append() is doing than fcs = yield(...).


def listFcsInGDB(gdb):
''' list all Feature Classes in a geodatabase, including inside Feature Datasets '''
arcpy.env.workspace = gdb
print 'Processing ', arcpy.env.workspace

fcs = []
for fds in arcpy.ListDatasets('','feature') + ['']:
for fc in arcpy.ListFeatureClasses('','',fds):

#yield os.path.join(fds, fc)
fcs.append(os.path.join(fds, fc))
return fcs

gdb = sys.argv [1]
fcs = listFcsInGDB(gdb)
for fc in fcs:
print fc

Results:


d:\> python list-all-fc.py r:\v5\YT_Canvec.gdb
Processing r:\v5\YT_Canvec.gdb
Buildings_and_structures\BS_2530009_0
Buildings_and_structures\BS_2380009_2
Buildings_and_structures\Tower
Buildings_and_structures\Underground_reservoir
...

This is now in a module I call arcplus*. Place with your other code or PYTHONPATH and then:


import arcplus

fcs = arcplus.listAllFeatureClasses('d:\default.gdb')
for fc in fcs:
print "magic happens with: ", fc

Arcplus also adds wildcard filtering; to process only feature classes that start with "HD_" within feature datasets containing "Hydro"


fcs = arcplus.listAllFeatureClasses(gdb, fd_filter='*Hydro*', fc_filter='HD_*')

.* now on Github, upgraded for 10.x. For arcgis 9.3 see here.


Storing GPS tracks with timestamps in PostGIS


I need to store a series of GPS points with timestamps in the database (traces of various vehicles).


I am wondering which of two approaches to choose for storing them in the PostGIS table: 1.) Each point in own row with separate column for timestamp and one for track ID


2.) Use Linestring or MultiLineString with fourth M coordinate which would contain UNIX timestamp of the time for the point on the track. This would mean single row for each separate track.


Answer


It depends on what you will want to do with the data once they are loaded in the database. If each data point has associated attributes in addition to time (e.g., engine temperature reading, a photo) or of you will want to use the point data in an analysis, then storing each datum in its own row is a good choice.


If each track has associated attributes (e.g., event name) or your analyses will be on tracks (e.g., find track crossings), then it makes more sense to store each as a (MULTI)LINESTRING.


If you choose one approach it won't prevent you from doing the analyses in the other. It will just require some extra steps.


google earth engine - Pixel value in export GeoTIFF file stretched by color value


I have exported GeoTIFF files from GEE and attempted to keep the pixel value in that raster layer. Once the file was imported into ArcGIS Pro the stats (min, max, mean and sd) were stretched between 0-255 instead of keeping the original pixel value from NDVI. Below is my code:


//get mean and std of NDVI

var mean = ee.Number(stats.get('NDVI_mean'));
var std = ee.Number(stats.get('NDVI_stdDev'));
//find regions in ndvi has value higher than mean +1SD
var maskImage = ndvi.updateMask(ndvi.gt(mean.add(std)));
//use the visualize function to set visualize parameters min and max equals to min and max in the raster
var visualizeMinMaxNDVI = function(maskImage) {
var minMax = maskImage.reduceRegion({
reducer: ee.Reducer.minMax(),
bestEffort: true,
});

var visParams = {
min: minMax.getNumber('NDVI_min'),
max: minMax.getNumber('NDVI_max')
};
return maskImage.visualize(visParams)
.set({min: minMax.getNumber('NDVI_min'), max: minMax.getNumber('NDVI_max')});
};

// set visualization parameters based on min and max value
var maskImage = visualizeMinMaxNDVI(maskImage);


// Export a cloud-optimized GeoTIFF.
Export.image.toDrive({
image: maskImage,
description: '21072016UNDVItest',
scale: 10,
region: table,
fileFormat: 'GeoTIFF',
formatOptions: {
cloudOptimized: true

}
});

I'm very new to GEE, I think when I export my GeoTIFF layer the data was 8 bit (shown in ArcGIS Pro) which caused the color stretch?


qgis - Merging close lines using v.clean


I downloaded some road network data derived from OSM by GeoFabrik, see the initial state: Near Székesfehérvár (Hungary) Near Székesfehérvár (Hungary), parallel lines are probably trunk or motorway roads.


I would like to simplify it like this (drawn in Paint): enter image description here


I would like to use open source stuff for that (QGIS, GRASS), so I tried v.clean and v.simplify, v.generalize in some combination. Unfortunately, I cannot reach the desired result.


With v.clean 'snap' method, tolerance=50 I reached this:


After v.clean snap.


But I don't need duplicated geometries, or identical zig-zag lines. Probably the v.generalize.network (Closeness, Betweeness threshold) would solve the problem, if it worked.


You can download the clipped geodata here: https://github.com/ewirth/gistemp


Answer


Buffering the road may be a solution to this problem.


  • create a dissolved buffer of the road using around 20 unit map distance. enter image description here


  • import the layer into a postgis database and create the middle line using ST_ApproximateMedialAxis() function:


SELECT ST_ApproximateMedialAxis(geom) AS geom INTO road_centre_line FROM road_buffer;


  • in order to access this function you have to enable the postgis_sfcgal extension

  • with this you will get an output like this enter image description here


arcgis desktop - For every point, distance to nearest polygon of type X?


In ArcGIS Desktop, can you calculate as an attribute value the distance to the nearest polygon of type X?


Assume we have a point layer of wildlife observations and we want to know how far each of them is from the nearest wetland.


Your answer should mention whether it is specific to ArcGIS Desktop v9 or 10, and the necessary license level.


Answer


Performing a Spatial Join will do this. Right click on the point layer and choose "Joins and Relates > "Join". In the Join Data dialog box, choose "Join data from another layer based on spatial location" in the drop down. Then choose the polygon layer you want joined. Then choose the radio button that says "is closest to it". (The selections are a little different if you're joining points to lines)


This function is also available in ArcToolbox, which is supposed to give better performance with large datasets, and provides some extra functionality.


This method is available in all versions of ArcGIS, and at all license levels.


arcgis 10.1 - Generating true curve elliptical polygons in file geodatabase using ArcPy?


As background, this question arose from trying to answer a question on How to generate overlapping polygons from lines output from Table To Ellipse tool?


Using the ArcMap 10.1 GUI it is very easy to digitize true curve polygons into a file geodatabase feature class using the Ellipse Construction Tool but ...


Is it possible to write true curve elliptical polygons while reading rows (arcpy.da.SearchCursor) from a table containing a centre point, a major axis, a minor axis and an azimuth for each?


I had hoped that there might be a token available with arcpy.da.InsertCursor to do this, but SHAPE@ seems to be limited by what the Geometry object supports, and that does not appear to include true curves.


Answer


While arcpy Geometry objects do not support true curves, at 10.3, Esri implemented True Curves in the REST API, and therefore had to implement JSON support for them in FeatureSets. So you can "trick" arcpy into doing this for you if you create a curve in a JSON structure.


Here's an example: create a JSON file with true curves (this uses a circular arc and a Bezier curve), something like this:


{   'fieldAliases': {
'Id': 'Id',
'FID': 'FID'
},

'fields': [{
'alias': 'FID',
'type': 'esriFieldTypeOID',
'name': 'FID'
}, {
'alias': 'Id',
'type': 'esriFieldTypeInteger',
'name': 'Id'
}],
'displayFieldName': '',

'spatialReference': {
'wkid': 103734,
'latestWkid': 103734
},
'geometryType': 'esriGeometryPolyline'
'features': [{
'geometry': {
"curvePaths":[[
[6,3],[5,3],
{"b":[[3,2],[6,1],[2,4]]},

[1,2],
{"a":[[0,2],[0,3],0,0,2.094395102393195,1.83,0.33333333]}
]]
},
'attributes': {
'Id': 0,
'FID': 0
}
}],
}


Then, load that into a feature set and save it out to a Feature class.


fs = arcpy.FeatureSet()
fs.load(r'C:\path_to_your_json_file.json')
arcpy.management.CopyFeatures(fs, r'in_memory\test_curve')

And boom, you have true curves! This is what it created in ArcMap:


enter image description here


So in your case, maybe you can build a json structure by either casting the original features to a feature set and playing with the JSON, or as you iterate through rows in a search cursor. The math may be a little tricky to get what you want, but definitely is doable.


I should also mention that you don't have to form a full feature set, you can just pass the JSON geometry directly into the arcpy.AsShape(geojson, True) as well to get a geometry object back.


Getting duplicate values when joining .csv spreadsheet to .shp map layer using QGIS?


I need to join .csv/spreadsheet data to the .shp map layer. The join itself isn't a problem with same join & target values (building) but some data goes missing because of duplicate values.


For example, if the map data is buildings and spreadsheet contains information about workers: info from workers from the same building gets missed because the join is done by the value of the building to combine spreadsheet to the building map layer.


How do I present all the information about workers in the map even if the info is from the same building?


The join isn't possible with any other value.


For example


enter image description here


qgis - Which interpolation technique is suitable for a bathymetry of a small lake?


This is a lake of approximately 13 ha with 81 sampled depth points in about 10 transect lines:


Sampled points


Previously in ARCgis with a 50 ha lake and about a 100 depth sampling points, I got decent output with the TopotoRaster tool. However, no such exact equivalent seems to exist with QGIS or open source software.


In QGIS, I got the interpolated raster below, using the TIN method in the Raster Interpolation plugin. However, this seemed to be a lucky outcome, when I tried to repeat, I got different results (unsatisfactory) in spite of not really varying any parameter.


Interpolated raster


These are more urban (constructed) tanks than lakes, therefore, they are fairly regular in their bed profile, hence the low point sampling density. Some articles seemed to suggest Inverse Distance Weighting (IDW) as the most suitable technique, yet I seemed to get the worst results with that (possibly owing to low point density).


Are there any heuristics which can be employed here considering the size of the lake, its regular profile and the point sampling density to arrive at which interpolation method is apt? (between Kriging, IDW, Bilinear, Cubic convolution, TIN or spline)


Or is it always a bit of trial and error?


geoprocessing - Linux alternatives to visualize and analyze LiDAR datasets?


For a long time I have been using softwares based in Windows to visualize and analyze LiDAR data sets for forest application. Recently, I have started to move all my work to Ubuntu platform, but I'm still looking for good softwares to work with LiDAR data sets.


Related to Windows the best free software experienced by me were:


  1. Just for visualization:


    a) Quick Terrain Reader is capable of opening pre-built digital elevation models (DEMs) and point clouds and allows users to freely move through the terrain in a fast and intuitive way.


    b) FugroViewer is a robust, easy-to-use freeware designed to help users make the most of their geospatial data.


    c) PointVue LE is a FREE 3-D LIDAR visualization tool which can be used to visualize LIDAR data in ASPRS LAS Version 1.1 format.


  2. For analyze and visualize:


    a) FUSION/LDV provides a fast, efficient and flexible access to LiDAR and terrain data sets.


Since I moved to Ubuntu, it was quite difficult to substitute the software I was used to use. Up to now, I found some alternatives but not so good as the Windows ones:


  1. For visualization:


    a) LiDAR visualization was implemented as an out-of-core multi resolution point cloud renderer. The renderer is able to visualize the largest LiDAR scans we currently have, containing up to 11.3 billion (11.3 * 109) sample points, at interactive frame rates using a fixed-size memory cache.


    b) LAG is a tool for visualisation, inspection and classification of LiDAR point clouds. It currently supports LAS and ASCII file formats.


Unfortunately, I couldn't find anything for processing like FUSION.


Has somebody experienced good free software to Linux related to LiDAR files analysis?


Do not just list other software, but explain why you use and recommend it!


qgis - How to translate tens of images from a directory as a batch with gdal_translate?


For example i have a dataset of images in *.cub format like


$path: /work/120614/mg_1164/
f01.img.cub_E.cub
f02.img.cub_E.cub
'
'
f0n.img.cub_E.cub


for converting a single image I use gdal_translate f01.img.cub_E.cub fo1.tif for whole the datasets.HOW? batch file?


Can I use a remote folder as GeoServer data directory


Can I define a remote folder as Geoserver data directory? My Geoserver installation is on Ubuntu and the data directory that I would like to save/fetch my data from is located on a Windows server that exists in the same network.


Monday 27 May 2019

arcobjects - How do I remove Schema Locks from a File GeoDatabase in Java in ArcGis 9.3?


I have an application written in Java which uses ArcObjects 9.3. The application accesses a file GeoDatabase. The application produces output in the GeoDatabase that will be accessed by ArcMap. The problem is that ArcMap can't access the file GeoDatabase because my application still has locks on it. The only workaround I have is to close my application, which removes all the locks. But there's got to be a better way than that. Does anyone have a solution for freeing up these locks?


FileGDBWorkspaceFactory fileGDBWF;
fileGDBWF = new FileGDBWorkspaceFactory();
ws = new Workspace(fileGDBWF.openFromFile(workspacePath, 0));


arcpy - Using Python to select records by date field


I am trying to write a python script to select records created within the past 7 hours (date field - database time) using a where-clause within arcpy. The table is ArcSDE database (Microsoft SQL Server).


I've written a script that calculates the time 7 hours prior to the current time. Then I want to use the "report_time" variable to select the relevant records in a table view but I'm getting an invalid expression error. I've tried to reformat the SQL statement in every way I could think of and still get the invalid expression error (I've kept them in my script and commented them out for reference).


-- Get start and end times for report


start_time= datetime.timedelta(hours = 7)
end_time = datetime.datetime.now()

report_time = end_time-start_time #this is the time that gets used to filter records

-- find all records that are later than or = to report_time

SQL = "created_date >= " + report_time.strftime('%m/%d/%Y')
print SQL


arcpy.SelectLayerByAttribute_management(ViewTable,"NEW_SELECTION", SQL)

-- SQL = "created_date >= " + str(report_time.strftime('%m/%d/%Y'))

-- SQL = '"created_date"<='+ report_time.strftime('%Y/%m/%d')

-- SQL = '"created_date"<='+ report_time.strftime('%m/%d/%Y')

-- SQL = "'created_date'<= "+ report_time.strftime('%m/%d/%Y')


-- SQL = '"created_date"<='+ report_time.strftime('%m/%d/%Y %I:%M:%S %p') - ExecuteError: ERROR 000358: Invalid expression

-- SQL = "'created_date'<= "+ report_time.strftime('%m/%d/%Y %I:%M:%S %p') - ExecuteError: ERROR 000358: Invalid expression

-- SQL = "'created_date'<= "+ str(report_time.strftime('%m/%d/%Y %I:%M:%S %p'))

-- SQL = '"created_date"<='+ str(report_time.strftime('%m/%d/%Y %I:%M:%S %p'))

--SQL = '"created_date"<= report_time.strftime'('%m/%d/%Y %I:%M:%S %p') - TypeError: 'str' object is not callable


--SQL = '"created_date" <= report_time' #this returns an expression error

--SQL = "'created_date' <= report_time" #also tried this - expression error

--SQL = 'created_date'<= report_time # returns error: TypeError: can't compare datetime.datetime to str


Converting ArcGIS topology rules file (*.rul) to *.txt, *.csv or *.xls for reviewing?


Has anyone converted ESRI's topology rules file (.rul) into another format?


I built a complex topology rules set and would like to QC it in something easier to read and work with than ArcCatalog.


A text file and spreadsheet format would work great.


sql - How to interpolate GPS Positions in PostGIS


I have a PostGIS table of GPS positions for every five seconds:


2011-01-01 00:00:05, POINT(x1,y1)
2011-01-01 00:00:10, POINT(x2,y2)
2011-01-01 00:00:15, POINT(x3,y3)
...

I'm looking for a query that will return values (timestamp and point) for every second. It's ok to assume that points are connected by a straight line.


I'm specifically looking for a way to do this inside the database and not by writing some external script.


Answer


hallo


If your original table is called gps_p, your timestamp field is called ts and the points is called th_geom:


SELECT (geom).geom,  ts1 + (((geom).path[1]-1) ||' seconds')::interval FROM 
(SELECT ts1, ST_DumpPoints(ST_Segmentize(geom, ST_Length(geom)/5)) as geom FROM
(SELECT ts1, ST_LineFromMultipoint(ST_Union(geom1, geom2)) as geom FROM
(SELECT p1.ts as ts1, p2.ts as ts2, p1.the_geom as geom1, p2.the_geom as geom2
FROM gps_p p1 INNER JOIN gps_p p2 on p1.ts + '00:00:05'::interval = p2.ts
) a
)b
) c

WHERE (geom).path[1] <= 5;

What it does is that it builds lines between the points and use st_segmentize to divide the line in 5 segments.


If it is not exactly 5 seconds between your original points it will not work. Then you can just add an id field with a sequence and use that to selfjoin the table with id1+1 = id2 instead.


HTH


/Nicklas


export - Exporting from Wikimapia to KML?


I'm not a API person but a GIS user and I would like to export points from a category from Wikimapia to KML or any other useful GIS formats.


Has anyone developed that?


It could be interesting to add the analysis that we need to the data from wikimapia.


Creating Latitude Grid from DEM


I am trying to evaluate an equation in the raster calculator and I need latitude values. I have the DEM for the region and am wondering if it is possible to create a latitude raster based on the DEM?


Thanks a lot!


Sunday 26 May 2019

QGIS installation has stopped running when startup?


My laptop is Windows 10 and I have installed QGIS 2.14 64bit twice; because due to some problems I uninstalled the software and reinstalled it. Now: "qgis has stopped running when startup"


I have searched for solutions on GIS SE and here is what I have done:


  1. I delete the .qgis2 but it fails;

  2. I tried to run qgis-ltr-bin.bat as "gis.stackexchange.com" guides but it fails;

  3. I tried to uninstall and delete everything about QGIS in C: drive as "gis.stackexchange.com" guides but it fails;

  4. I tried to install other software like 2.18 64bit but it also fails.


leaflet - Convert GeoJSON with multiple Polygons and MultiPolygons into single MultiPolygon?


Is this even possible?


I have a GeoJSON file with multiple polygons and multipolygons, and I need to set styling on them (in Leaflet.js). I'd like to create a single, large MultiPolygon from the individual MultiPolygons and Polygons.


How can I do this (preferably in Node.js or at the Linux command-line)?


Things get really tricky when there's a MultiPolygon consisting of Polygons AND other Multipolygons.


Can this be "cleaned up" without any loss of information?


Answer


You could do this using Javascript Topology Suite which will work with Node.js. Start with an empty MultiPolygon (or the first geometry in your collection) and union this with each (Multi)Polygon in your collection. You can only have one format for the whole collection, obviously, as properties are one to one with the geometry in the GeoJSON. Here are some jsts/node.js examples.


There is also a GeoJSON parser in jsts, which will return a jsts geometry. So putting it all together, you would do something along the lines of:


var jsts = require("jsts");


var reader = new jsts.io.GeoJSONParser();

//read your geometries
var geoms = reader.read(geojson);

//grab the first one
var multipolygon = geoms[0];

//union with all the others
for (var x=1; x < geoms.length ; x++){

multipolygon = multipolygon.union(geoms[x]);
}

This is untested, but the general idea should work. You would have to recreate the GeoJSON with properties afterwards, but this should be easy with the built in JSON methods in Javascript.


arcgis desktop - How to split circles in 8 quadrants


I am using ArcGis 9.3 and I need to split a large number of circles in quadrants. The circles corresponde to a 200m buffer of a point layer and, for each point, I need to split the buffer in 8 quadrants. Is there any ArcGis tool or extension that does this for all points/buffers at the same time?


what is the main idea of new (since osm2po ver 4.7.7) MultiLevelGridRouter


in the new osm2po v4.7.7 release notes I see that there is new MlgRouter (MultiLevelGridRouter) "which is an at least five times faster DefaultRouter". Could someone clarify why it's so fast (what assumptions/concept cause such dramatic speedup? what is the main idea of Multi Level Grid?) and for what cases it's applicable/recommended to use?


Answer


There are many (even optimal) speed-up-techniques for goal directed routing. One very prominent candidate is the AStar-Algo which uses heuristics based on geographic informations. Another one is the MultiLevel-Routing which bases on precalculated highway levels. The precalculation step detects low and high level roads and the routing algo can ignore low level streets in the middle of the path. One of the best algos of this class is the CH used by OSRM or MoNav. The disadvantage is the memory overhead and a very long precalculating time. Hence osm2po uses a very simple technique which doesn't hurt the memory and the runtime too much. Another disadvantage is that one precalculated set of levels only fits to exactly one use case. "fastest-path" e.g. would be one, "shortest-path" another.


In order to enable this feature, read the comments/hints in osm2po.config. All you have to to is


  1. Enable postp.2.class=de.cm.osm2po.converter.MlgBuilder (config)


  2. Enable graph.support.extensions=true (config)

  3. Run osm2po with at least (cmd=gp)

  4. Enable one or more MlgRouters (config)

  5. Open the WebTestUI


Tipp: Test it with a medium sized country, Spain eg. and you'll see the difference between the DefaultRouter and the MlgRouter.


qgis - PostGIS query that selects feature if it goes outside boundary


I am looking of a postGIS function that will select the highlighted line in the picture below. Using st_intersection I can clip the lines to the polygon, but i'm looking to select the one line that breaks out of the polygon. The trouble is the line originates inside the polygon so st intersects, st crosses, st intersection both return all lines not just the one that breaks out of the polygon.


enter image description here


google maps - Calculate bearing between two decimal GPS coordinates


I'm building a virtual tour application that uses custom panoramas in conjunction with Google's StreetView service. With StreetView, you can have 1 to n links at each particular location to move to, and these links are based on compass bearings.


Each panorama has an associated GPS location to six decimal places acquired via iTouchMaps. My issue is when I calculate the compass bearings from each link location, it returns a bearing that is a tiny (as in 0.00001 degree difference) from true north.


Given a map like


                       4
|

|
|
2
|
|
|
1

where each number is a location and has the following values:


1- 43.682213, -70.450696

2- 43.682194, -70.450769
4- 43.682179, -70.450837

What I'd like is a method to determine programatically that the bearing from 1 to 2 and 2 to 4 is 70 degrees, and 2 to 1 is 250 degrees. Using the code from here as a starting point, I wrote the following function


//starting lat/long along with converting degrees to radius
var endLat = location.lat(); //for rhumb calc
var endLong = location.lng();

//loop over response, calculate new headings for links and add link to array
for(var i=0; i
//this link's lat/long coordinates
var startLat = data[i].lat;
var startLong = data[i].lon;

//get the delta values between start and end coordinates
var dLong = endLong - startLong;

//calculate rhumb bearing to
var dPhi = Math.log(Math.tan(endLat/2+Math.PI/4)/Math.tan(startLat/2+Math.PI/4));
if (Math.abs(dLong) > Math.PI ) dLong = dLong > 0 ? -(2*Math.PI-dLong) : (2*Math.PI+dLong);

var bearing = (toDeg(Math.atan(dLong, dPhi)) + 360) % 360;

Using the above function and substituting


location for position 2
data[0] for position 1
data[1] for position 4

I get the bearings


359.9958174081038 degrees to 4 (should be 70 degrees)


and


0.0038961130024404156 degrees to 1 (should be 250)

Why is this function returning such different values than expected?


Answer


It looks to me like you need to perform the trigonometry in radians not degrees. You use a function toDeg() so presumably you have one called toRad() (or possibly fromDeg() if you're odd). Call that function with your latitude and longitude values before the calculations, and you should be set.


Edit


I just tried this in Python (the syntax isn't dissimilar to JavaScript) using radians and your coordinates:


startLat = math.radians(43.682213)
startLong = math.radians(-70.450696)

endLat = math.radians(43.682194)
endLong = math.radians(-70.450769)

dLong = endLong - startLong

dPhi = math.log(math.tan(endLat/2.0+math.pi/4.0)/math.tan(startLat/2.0+math.pi/4.0))
if abs(dLong) > math.pi:
if dLong > 0.0:
dLong = -(2.0 * math.pi - dLong)
else:

dLong = (2.0 * math.pi + dLong)

bearing = (math.degrees(math.atan2(dLong, dPhi)) + 360.0) % 360.0;

print(bearing)

and I get 250.20613449 as expected.


arcgis 10.0 - arcobject.net Addin Toolbar only works once


I created a toolbar using ArcObjects 10.0 which does some heavy processing in the onClick event of the only button it includes. It works fine however it works only once. If I click again on the button nothing happens. To run it again I need to restart ArcMap and run it again. I cannot understand this behavior?


i am working for Electrical Data set, which is having a tree like network, and network should be downstream, there are some lines which lies opposite direction in it. need to identify those lines. below is the example.


enter image description here


below is the process flow i am using in my tool.


enter image description here


Below is the Code linked to click event of the button:


public WrongDirection()
{
//Setting Status Bar
IStatusBar pstatusbar = ArcMap.Application.StatusBar;
pstatusbar.ShowProgressBar("Running wrong Direction..", 0, 17, 1, true);


try
{

//Define IMxdocument and Imap
IMxDocument mxdoc = ArcMap.Application.Document as IMxDocument;
IMap map = mxdoc.FocusMap;
if (map.Layer[0] == null)
{ return; }


// Setting GXDialog for Output
IGxDialog pGXDialog = new GxDialogClass();
pGXDialog.AllowMultiSelect = false;
if (pGXDialog.DoModalSave(0) != true)
{
pstatusbar.HideProgressBar();
return;
}


pGXDialog.ButtonCaption = "Save";
pGXDialog.Title = "Save Wrong Direction Points Feature";
pGXDialog.RememberLocation = true;
IGxObjectFilter gxobjFilter = new GxFilterShapefilesClass();
pGXDialog.ObjectFilter = gxobjFilter;
pGXDialog.DoModalSave(0);
IGxObject pGxObject = pGXDialog.FinalLocation;
String s, Fp;
s = pGXDialog.Name;
Fp = pGxObject.FullName + "\\" + s;

pstatusbar.StepProgressBar();


// Merging HT Overhead Line and HT Underground Line
List STRHT = new List();
for (int i = 0; i < map.LayerCount; i++)
{
if (map.Layer[i].Name == "HT Overhead Line")

{
ILayer HTOverheadLine = map.Layer[i];
IFeatureLayer fl1 = new FeatureLayerClass();
fl1 = HTOverheadLine as IFeatureLayer;
IDataset dataset = (ESRI.ArcGIS.Geodatabase.IDataset)(HTOverheadLine);
STRHT.Add(dataset.Workspace.PathName + "\\" + ((IDataset)fl1.FeatureClass).BrowseName);
}
else
{
if (map.Layer[i].Name == "HT Underground Line")

{
ILayer HTUndergroundLine = map.Layer[i];
IFeatureLayer fl2 = new FeatureLayerClass();
fl2 = HTUndergroundLine as IFeatureLayer;
IDataset dataset = (ESRI.ArcGIS.Geodatabase.IDataset)(HTUndergroundLine);
STRHT.Add(dataset.Workspace.PathName + "\\" + ((IDataset)fl2.FeatureClass).BrowseName);
}
}
}
string combindedStringHT = string.Join(";", STRHT.ToArray());

IGeoProcessor gp = new GeoProcessorClass();
gp.AddOutputsToMap = true;
gp.OverwriteOutput = true;
IVariantArray parameters = new VarArrayClass();
parameters.Add(combindedStringHT);
parameters.Add(@"D:\MergeHT.shp");
gp.Execute("Merge_management", parameters, null);
pstatusbar.StepProgressBar();


// Deleting extra field from mergeHT
IGPUtilities2 gpUtils = new GPUtilitiesClass();
IFeatureClass featureClass = gpUtils.OpenFeatureClassFromString(@"D:\MergeHT.shp");
IFields2 fields = featureClass.Fields as IFields2;
IField2 nameField = null;
for (int fieldIndex = fields.FieldCount - 1; fieldIndex > -1; fieldIndex = fieldIndex - 1)
{
nameField = fields.Field[fieldIndex] as IField2;
if (nameField.Name != "FID" && nameField.Name != "Shape" && nameField.Name != "OBJECTID" && nameField.Name != "SUBTYPECD")
{

featureClass.DeleteField(nameField);
}
}
pstatusbar.StepProgressBar();


//Merging LT Overhead and LT underground into one
List STRLT = new List();
for (int i = 0; i < map.LayerCount; i++)

{
if (map.Layer[i].Name == "LT Overhead Line")
{
ILayer LTOverheadLine = map.Layer[i];
IFeatureLayer fl3 = new FeatureLayerClass();
fl3 = LTOverheadLine as IFeatureLayer;
IDataset dataset = (ESRI.ArcGIS.Geodatabase.IDataset)(LTOverheadLine);
STRLT.Add(dataset.Workspace.PathName + "\\" + ((IDataset)fl3.FeatureClass).BrowseName);
}
else

{
if (map.Layer[i].Name == "LT Underground Line")
{
ILayer LTUndergroundLine = map.Layer[i];
IFeatureLayer fl4 = new FeatureLayerClass();
fl4 = LTUndergroundLine as IFeatureLayer;
IDataset dataset = (ESRI.ArcGIS.Geodatabase.IDataset)(LTUndergroundLine);
STRLT.Add(dataset.Workspace.PathName + "\\" + ((IDataset)fl4.FeatureClass).BrowseName);
}
}

}
string combindedStringLT = string.Join(";", STRLT.ToArray());
IGeoProcessor gp7 = new GeoProcessorClass();
gp7.AddOutputsToMap = true;
gp7.OverwriteOutput = true;
IVariantArray parameters7 = new VarArrayClass();
parameters7.Add(combindedStringLT);
parameters7.Add(@"D:\MergeLT.shp");
gp7.Execute("Merge_management", parameters7, null);
pstatusbar.StepProgressBar();


// Deleting extra field from mergeLT
IGPUtilities2 gpUtilsLT = new GPUtilitiesClass();
IFeatureClass featureClassLT = gpUtilsLT.OpenFeatureClassFromString(@"D:\mergeLT.shp");
IFields2 fieldsLT = featureClassLT.Fields as IFields2;
IField2 nameFieldLT = null;
for (int fieldIndex = fieldsLT.FieldCount - 1; fieldIndex > -1; fieldIndex = fieldIndex - 1)
{
nameFieldLT = fieldsLT.Field[fieldIndex] as IField2;
if (nameFieldLT.Name != "FID" && nameFieldLT.Name != "Shape" && nameFieldLT.Name != "OBJECTID" && nameFieldLT.Name != "SUBTYPECD")

{
featureClassLT.DeleteField(nameFieldLT);
}
}
pstatusbar.StepProgressBar();


//Merging LT and HT into single Merge
IGeoProcessor gp10 = new GeoProcessorClass();
gp10.OverwriteOutput = true;

IVariantArray parameters10 = new VarArrayClass();
string STRM = "D:\\MergeHT.shp;D:\\MergeLT.shp";
parameters10.Add(STRM);
parameters10.Add(@"in_memory\Merge");
gp10.Execute("Merge_management", parameters10, null);
pstatusbar.StepProgressBar();


// running Feature to Vertices GP tool
IGeoProcessor gp2 = new GeoProcessorClass();

gp2.AddOutputsToMap = true;
gp2.OverwriteOutput = true;
IVariantArray parameters2 = new VarArrayClass();
parameters2.Add(@"in_memory\Merge");
parameters2.Add(@"in_memory\Vertices");
parameters2.Add("END");
gp2.Execute("FeatureVerticesToPoints_management", parameters2, null);
pstatusbar.StepProgressBar();


// running Feature to CollectEvents GP tool
IGeoProcessor gp3 = new GeoProcessorClass();
gp3.AddOutputsToMap = true;
gp3.OverwriteOutput = true;
IVariantArray parameters3 = new VarArrayClass();
parameters3.Add(@"in_memory\Vertices");
parameters3.Add(Fp);
gp3.Execute("CollectEvents_stats", parameters3, null);
pstatusbar.StepProgressBar();


// Deleting Records which are not duplicates by using Featurecursor.
IGPUtilities2 gpUtilsWW = new GPUtilitiesClass();
IFeatureClass featureClassww = gpUtilsLT.OpenFeatureClassFromString(Fp);
IQueryFilter qF = new QueryFilterClass();
qF.WhereClause = "ICOUNT = 1";
IFeatureCursor featureCursor = featureClassww.Search(qF, false);
IFeature feature = null;
while ((feature = featureCursor.NextFeature()) != null)
{
feature.Delete();

}
pstatusbar.StepProgressBar();


// deleting MeregeHT Shape
IGeoProcessor gp5 = new GeoProcessorClass();
gp5.AddOutputsToMap = true;
gp5.OverwriteOutput = true;
IVariantArray parameters5 = new VarArrayClass();
parameters5.Add(@"D:\MergeHT.shp");

gp5.Execute("Delete_management", parameters5, null);
pstatusbar.StepProgressBar();


// deleting MeregeLT Shape
IGeoProcessor gp8 = new GeoProcessorClass();
gp8.AddOutputsToMap = true;
gp8.OverwriteOutput = true;
IVariantArray parameters8 = new VarArrayClass();
parameters8.Add(@"D:\MergeLT.shp");

gp5.Execute("Delete_management", parameters8, null);
pstatusbar.StepProgressBar();

// deleting MeregeLT Shape
IGeoProcessor gp9 = new GeoProcessorClass();
gp9.AddOutputsToMap = true;
gp9.OverwriteOutput = true;
IVariantArray parameters9 = new VarArrayClass();
parameters9.Add(@"in_memory\Merge");
gp9.Execute("Delete_management", parameters9, null);

pstatusbar.StepProgressBar();

// deleting Vertices Shape
IGeoProcessor gp6 = new GeoProcessorClass();
gp6.AddOutputsToMap = true;
gp6.OverwriteOutput = true;
IVariantArray parameters6 = new VarArrayClass();
parameters6.Add(@"in_memory\Vertices");
gp6.Execute("Delete_management", parameters6, null);
pstatusbar.StepProgressBar();


// Removing Layer from TOC
for (int i = map.LayerCount - 1; i > -1; i--)
{
if (map.Layer[i].Valid)
{
}
else
{
ILayer DeleteLayer = map.Layer[i];

map.DeleteLayer(DeleteLayer);
}
}
pstatusbar.StepProgressBar();

// Refreshing Active View
mxdoc.ActiveView.Refresh();
pstatusbar.StepProgressBar();
pstatusbar.HideProgressBar();


}
catch (Exception ex)
{
pstatusbar.HideProgressBar();
MessageBox.Show("Error: " + ex.ToString(), "Exception", MessageBoxButtons.OK, MessageBoxIcon.Exclamation);
return;
}
}


Using Proj4js in Openlayers - Proj4js is not defined


I want to use Proj4js.


I get a javascript error: ReferenceError: Proj4js is not defined. When I look at the source specified at /cdnjs.cloudflare.com/ajax/libs/proj4js/2.3.3/proj4-src.js, I do not see any specification of an object called Proj4js having a property defs. Still, that is what the tutorials are saying (like http://wiki.openstreetmap.org/wiki/OpenLayers_Simple_Example).


What do I do wrong?


Answer


You have two choices


Solution 1:


You can change the reference to proj4js. OpenLayers 2.x default support is with Proj4js 1.1 whereas you use 2.x.


Demo 1 (open the browser console to see)


Solution 2:


Or you can use the new proj4js version by adding a wrapper to match previous version behaviour:


Demo 2 (open the browser console to see)


You may encounter some border effects although it seems minor according to the thread about OpenLayers 2.x support with Proj4js 2.x series


There was small difference between both results but now it's OK. It was due to parameters correction with proj4js for this particular projection (EPSG:31466).


arcpy - Enumeration Problem with Eclipse and arcgisscripting?


i'm recently using Python for my Processing work that I do with ArcGis 9.3. I figured out, that using Eclipse (with PyDev) could be helpfull for debugging purpose. The geoprocessor is starting as demanded.


Nevertheless i got into trouble using a Example-Script from Esri: http://webhelp.esri.com/arcgisdesktop/9.3/index.cfm?TopicName=fieldmappings_properties


fcs = gp.ListFeatureClasses("block*", "Polygon")

for fc in fcs:

This causes an error:


File "C:\Python26\lib\site-packages\win32com\client\dynamic.py", line 228, in __getitem__
raise TypeError, "This object does not support enumeration"


The Script works fine when starting from ArcCatalog! It seems that the variable "fcs" is of type "instance" and that python ain't able to enumerate this type.


But why doesn't ArcGIS 9.3 have a problem with this? Does anybody know this?


Answer


You can work around this using this idiom:


fcs = gp.ListFeatureClasses("block*", "Polygon")
for fc in iter(fcs.next, None):

Saturday 25 May 2019

geoprocessing - ArcGIS Toolbox functions missing all parameters?


I recently installed ArcGIS 10.3.1 and now all the toolbox functions (that I have tried) open, but they have no parameter fields. For example, the "Add Field" tool comes up with the standard toolox dialog with the title bar, buttons at the bottom, and a functional help panel, but the rest of the dialog is entirely empty.


I've run a repair on the installation.


Has anyone else seen this? Any fixes?


Same thing after uninstalling all ArcGIS applications and reinstalling. Other details: Windows 7, 64 bit, SP1, Intel CPU


Answer


Problems with JavaScript in IE were the problem. The toolbox uses JavaScript to display the parameter prompts. We used whatismybrowser.com/is-javascript-enabled to determine the status of JavaScript in both IE and Chrome. It was working in Chrome, but not in IE even though it was enabled in the settings. We found that our virus software had disrupted JavaScript in some registry settings, and updates to IE had not completed properly. Reinstalling IE, then restarting the virus protection restored JavaScript and the toolbox parameters.


Creating Mapbook with Hyperlink texts in PDF using QGIS Atlas?


I'm using QGIS 2.8.1 Atlas and creating a mapbook using a grid layer that has an attribute with a URL in it.


I want to use the URL in the attribute to be a hyperlink in the PDF once its published.


Is there just an expression I can use to do this?


geoserver - Vector layer not displaying in OpenLayers


I have this code from an Udemy course. Everything works except I can not visualize the vector layer. I can see the JSON file - wfs_url correctly but not visualize vectorSource (the data points selected in wfs_url).


Working with Vector Data


  var view = new ol.View({
center: [-9015705,4026797],
zoom: 11
});


var map = new ol.Map({
layers: [
new ol.layer.Tile({
source: new ol.source.OSM()
})
],
target: 'map',
view: view
});


var theurl = 'http://localhost:8050/geoserver/richland_postgres/wms';

var bk79 = new ol.layer.Image({
source: new ol.source.ImageWMS({
url: theurl,
params: {'LAYERS': 'richland:bk79'},
serverType: 'geoserver'
})

});
bk79.setOpacity(0.3);


var cqlfilter = 'DWITHIN(geometry,Point(503909 3768402),5000,meters)';

var schoolcql = new ol.layer.Image({
source: new ol.source.ImageWMS({
url: theurl,

params: {'LAYERS': 'richland_postgres:schools','CQL_FILTER': cqlfilter},
serverType: 'geoserver'
})
});


wfs_url = 'http://localhost:8050/geoserver/richland_postgres/wfs?service=WFS&' +
'version=1.1.0' +
'&request=GetFeature' +
'&typename=richland_postgres:schools&' +

'&CQL_FILTER=' + cqlfilter + '&' +
'outputFormat=application/json&srsname=EPSG:3857&' +
',EPSG:3857';
prompt('',wfs_url);

var vectorSource = new ol.source.Vector({
format: new ol.format.GeoJSON(),
url: function(extent) {
return 'http://localhost:8050/geoserver/richland_postgres/wfs?service=WFS&' +
'version=1.1.0' +

'&request=GetFeature' +
'&typename=richland_postgres:schools&' +
'&CQL_FILTER=' + cqlfilter + '&' +
'outputFormat=application/json&srsname=EPSG:3857&' +
',EPSG:3857';
},
strategy: ol.loadingstrategy.bbox
});

var vector = new ol.layer.Vector({

source: vectorSource
});


map.addLayer(bk79);
map.addLayer(schoolcql);
map.addLayer(vector);


Extraction of raster cell values based on 'rgeos' and 'raster' buffering approaches in R


I am trying to extract cell values from a raster that lie within a certain distance from a given location (i.e. buffering). Evaluating different approaches, I found out that applying gBuffer(..., width = 20000) from package rgeos generally includes fewer cells than extract(..., buffer = 2000) from package raster for one and the same buffer width. Does anybody know what's the difference between these two approaches?


Here's a reproducible example that comes close to my piece of code:


# Required packages
library(dismo)
library(raster)
library(rgeos)

# Sample raster data (and perform reclassification for clarity purposes)
germany <- gmap("Germany")
germany <- reclassify(germany, matrix(c(0, 200, 0,
200, 255, 1), ncol = 3, byrow = TRUE))


# Sample point shape data
nuremberg <- data.frame("lat" = 49.452778, "lon" = 11.077778, "city" = "Nuremberg")
# Set current CRS and reproject to raster CRS
coordinates(nuremberg) <- c("lon", "lat")
projection(nuremberg) <- CRS("+proj=lonlat +ellps=WGS84")
nuremberg <- spTransform(nuremberg, CRS(projection(germany)))

# Extract cell values using extract() only
nbg.val <- unlist(extract(germany, nuremberg, buffer = 20000))


# Extract cell values using gBuffer() and extract()
nbg.bff <- gBuffer(nuremberg, width = 20000)
nbg.val2 <- unlist(extract(germany, nbg.bff))

So far, so good. Now let's compare the results.


# extract() only
table(nbg.val)
nbg.val
0 1
118 91


# gBuffer() and extract()
table(nbg.val2)
nbg.val2
0 1
116 90

Of course, these are minor differences. However, using larger buffers and/or higher resoluted raster images, these discrepancies become larger and larger.


Answer


By making a buffer you approximate the distances (as you do not get a true circle, but a polygonal approximation of one). You can improve the rgeos answer by increasing the number of segments of the circle with the "quadsegs" argument:


nbg.bff2 <- gBuffer(nuremberg, quadsegs=50, width = 20000)
table( unlist(extract(germany, nbg.bff2)) )

0 1
118 91

What's the benefit of heterogeneous geometry column in PostGIS?


I read that in PostGIS, one can have different types of geometry, say, POINT and LINESTRING?? in the same column/field of a table.


I have used ESRI products a lot where each table can only contain one type of geometry. I am just curious what is benefit/motivation for allowing mixed geometry types in PostGIS columns?


To me, what PostGIS did is to have an array of Java ObjectS, which is kind of pointless, since an Object (or Geometry in the case of PostGIS) can be anything. We can't really reason much about the base class geometry (e.g. its dimension and inoperability with other entities etc.) because it's too abstract.


For example, polygons have no length, points have no meaningful lengths or areas (because points are often simplified representation of linear/areal objects). Naturally, one can't do statistics/aggregates such as finding out the average measure of a geometry field because a measure may not be defined for some rows, due to the lack of constraint on the specific type of the geometry.


Am I missing some beneficial aspects of the heterogeneous columns?


Also, are there any practical examples of hetergeneous columns for non-geometric types in Postgres? For example, a column that can be both float-ing point numbers and bytea, or is the mixed columns a PostGIS invention?


Answer


I will need to recheck my copy of "PostGIS in Action" by Regina Obe and Leo Hsu (Great book).


Basically it lists the pro's as:


  • It allows you to run a single query of several feature of interest without giving up the luxury of modeling them with the most appropriate geometry type

  • It's simple. you could cram all your geometries into one table if their non spatial attributes are more or less the same.


  • Table creation is quick because you can do it by setting the field as a geometry with a single create table statement and not have to worry about additional need to apply the AddGeometryColumn function, great if you are importing lots of tabulated data


If you can get hold of the book I highly recommend it. It is getting a bit old now and some functions may have changed.


Friday 24 May 2019

Avoiding fails from ArcObjects geoprocessing with .NET?


There are some nice features in ArcToolbox we can use, but for some reason, this is NOT working properly. It doesn't even throw me an error.


My software is running inside ArcMap, so no need to AoInitialize again, corret?


    public void Execute()
{
InitializeProduct();
try
{
Geoprocessor gp = new Geoprocessor();
gp.OverwriteOutput = true;


FeatureToPoint featureToPoint = new FeatureToPoint();

string outputPathName = CurrentWorkspace.PathName + "\\teste_centroide";

featureToPoint.in_features = InputFeatureClass;
featureToPoint.out_feature_class = outputPathName;
featureToPoint.point_location = "INSIDE";

IGeoProcessorResult result = (IGeoProcessorResult)gp.Execute(featureToPoint, null);


if (result == null)
{
for (int i = 0; i <= gp.MessageCount - 1; i++)
{
Console.WriteLine(gp.GetMessage(i));
}
}

IGPUtilities gpUtils = new GPUtilitiesClass();
this.OutputFeatureClass = gpUtils.OpenFeatureClassFromString(outputPathName);

}
catch (Exception ex)
{
MessageBox.Show(ex.Message + "\r\n");
}

This is a code example I'm having here. I generated the DataManagement tools assembly, but I could not find the file to sign it.


This code just gives me an error. is it because of the signing?


I've tried the other way too, using IVariantArray and calling from the tool name, without sucess. Is it just me or...?


Can anyone point me a "nicer" solution? I need to run several process that are already built in ArcToolbox that I really don't want to duplicate.


Answer


In the code below, the multi2single function works for me in 10.0. I couldn't test Feature2Point since I don't have an ArcInfo license, can you?.


public class Test
{
public static void TestGP(IApplication app)
{
IMxDocument mxDoc = (IMxDocument)app.Document;
//Feat2Point((IFeatureLayer)mxDoc.FocusMap.get_Layer(0), @"D:\Projects\AmberGIS\Forums\forumtest.gdb\f2p");
Multi2Single((IFeatureLayer)mxDoc.FocusMap.get_Layer(0), @"D:\Projects\AmberGIS\Forums\forumtest.gdb\m2s");
}


public static void Multi2Single(IFeatureLayer inLayer, string outPath)
{
MultipartToSinglepart m2s = new MultipartToSinglepart();
m2s.in_features = inLayer.FeatureClass;
m2s.out_feature_class = outPath;
Execute(m2s);
}

public static void Feat2Point(IFeatureLayer inLayer, string outPath)

{
FeatureToPoint f2p = new FeatureToPoint();
f2p.in_features = inLayer.FeatureClass;
f2p.out_feature_class = outPath;
Execute(f2p);
}

public static void Execute(IGPProcess proc)
{
Geoprocessor gp = new Geoprocessor();

gp.AddOutputsToMap = true;
gp.OverwriteOutput = true;
gp.RegisterGeoProcessorEvents((IGeoProcessorEvents)new GPEvents());
IGeoProcessorResult2 result = gp.Execute(proc, null) as IGeoProcessorResult2;
IGPMessages msgs = result.GetResultMessages();
for(int i=0;i Debug.Print("{0} {1}", msgs.GetMessage(i).Description, msgs.GetMessage(i).Type);
}
}
public class GPEvents : IGeoProcessorEvents3, IGeoProcessorEvents

{
#region IGeoProcessorEvents3 Members
public void OnProcessMessages(IGeoProcessorResult result, IGPMessages pMsgs)
{
Debug.Print("OnProcessMessages {0}", result.Status);
}
public void OnProgressMessage(IGeoProcessorResult result, string message)
{
Debug.Print("OnProgressMessages {0}", result.Status);
}

public void OnProgressPercentage(IGeoProcessorResult result, double percentage)
{
Debug.Print("OnProgressPercentage {0}", result.Status);
}
public void OnProgressShow(IGeoProcessorResult result, bool Show)
{
Debug.Print("OnProgressShow {0}", result.Status);
}
public void PostToolExecute(IGeoProcessorResult result)
{

Debug.Print("PostToolExecute {0}", result.Status);
}
public void PreToolExecute(IGeoProcessorResult result)
{
Debug.Print("PreToolExecute {0}",result.Status);
}
#endregion

#region IGeoProcessorEvents Members


void IGeoProcessorEvents.OnMessageAdded(IGPMessage message)
{
Debug.Print("OnMessageAdded {0} {1}", message.Description, message.Type);
throw new NotImplementedException();
}

void IGeoProcessorEvents.PostToolExecute(IGPTool Tool, ESRI.ArcGIS.esriSystem.IArray Values, int result, IGPMessages Messages)
{
Debug.Print("PostToolExecute2 {0}", Tool.Name);
}


void IGeoProcessorEvents.PreToolExecute(IGPTool Tool, ESRI.ArcGIS.esriSystem.IArray Values, int processID)
{
if (Tool.IsLicensed())
Debug.Print("PreToolExecute");
else
Debug.Print("tool is not licensed to run");
}

void IGeoProcessorEvents.ToolboxChange()

{
Debug.Print("ToolboxChange");
}

#endregion
}

I get this output in VS:


PreToolExecute
PostToolExecute2 MultipartToSinglepart

Executing: MultipartToSinglepart GPL0 D:\Projects\AmberGIS\Forums\forumtest.gdb\m2s esriGPMessageTypeProcessDefinition
Start Time: Thu Sep 02 11:32:44 2010 esriGPMessageTypeProcessStart
Succeeded at Thu Sep 02 11:32:51 2010 (Elapsed Time: 7.00 seconds) esriGPMessageTypeProcessStop

arcpy - Changing output name when exporting data driven pages to JPG?

Is there a way to save the output JPG, changing the output file name to the page name, instead of page number? I mean changing the script fo...